How to set up a visual bug reporting workflow
Text-only bug reports are a tax on engineering time. "The button doesn't work on the settings page" generates a chain of follow-up questions: Which button? Which settings page? What browser? What viewport? What exactly happens when you click it? What did you expect to happen?
By the time you have enough information to reproduce the issue, the original reporter has moved on and the context is cold. Teams that rely on text-only bug reports spend a measurable portion of their engineering time just collecting the information they needed before they could even start debugging.
Visual bug reporting solves this by capturing the full context of a bug at the moment the user encounters it. Annotated screenshot, page URL, browser, operating system, viewport size. Everything an engineer needs to reproduce and fix the issue, delivered in the initial submission.
Why text-only bug reports waste engineering time
The cost isn't just the back-and-forth. It's the cognitive load on the engineer who receives a report with missing information and has to make judgment calls about what was meant.
"The modal doesn't close" could mean:
- Clicking the close button does nothing
- Clicking outside the modal does nothing
- The modal appears briefly and closes on its own
- The modal closes but the page behind it breaks
Each of these is a different bug caused by different code. Without knowing which behavior the reporter observed, the engineer is guessing. Guessing means running the wrong test, in the wrong browser, on the wrong flow, and reporting back that they can't reproduce it.
A screenshot with an annotation showing exactly what the user saw eliminates the ambiguity. A circle around the frozen close button tells the engineer exactly where to look. The browser and OS metadata in the submission tells them exactly how to configure their environment to reproduce it.
The math is straightforward. If a text-only bug report requires three rounds of follow-up before it's actionable, and each round takes an average of 30 minutes of context-switching for the engineer and the reporter, that's 1.5 hours of overhead per bug before any work starts. A visual report that arrives with full context cuts that overhead to near zero.
What visual bug reporting captures
A well-implemented visual bug reporting tool captures four things automatically, without requiring the user to know or document any of it:
Annotated screenshot. The user can draw on the screenshot, add arrows, and highlight the problem area. The annotation is the context that transforms "something is wrong" into "this specific element is not behaving as expected."
Page URL. Automatically captured. The engineer can navigate directly to the affected page without asking where it is.
Browser and OS. Automatically captured. Cross-browser bugs that only appear in Safari on macOS or Chrome on Windows are only diagnosable when you know the environment. Requiring users to report this manually produces inconsistent and often incorrect data.
Viewport size. Automatically captured. Responsive layout bugs are invisible until you replicate the correct viewport. A report that includes the viewport dimensions tells you immediately whether you're looking at a mobile layout issue or a desktop one.
When all four are present in the initial submission, the average engineer can reproduce most UI bugs on the first attempt.
Step 1: Embed the feedback widget on your app or docs site
PushFeedback's widget embeds as a web component and works on any web app or documentation site regardless of the framework.
Add the CDN dependencies to your <head>:
<link rel="stylesheet" href="https://cdn.jsdelivr.net/npm/pushfeedback/dist/pushfeedback/pushfeedback.css">
<script type="module" src="https://cdn.jsdelivr.net/npm/pushfeedback/dist/pushfeedback/pushfeedback.esm.js"></script>
Then place the widget in your layout:
<feedback-button
  project="<YOUR_PROJECT_ID>"
  button-position="bottom-right"
  modal-position="bottom-right"
  button-style="dark">
    Feedback
</feedback-button>
For framework-specific installation (React, Next.js, Vue, Docusaurus, and others), see the installation reference. The widget captures browser, OS, viewport, and page URL automatically with every submission.
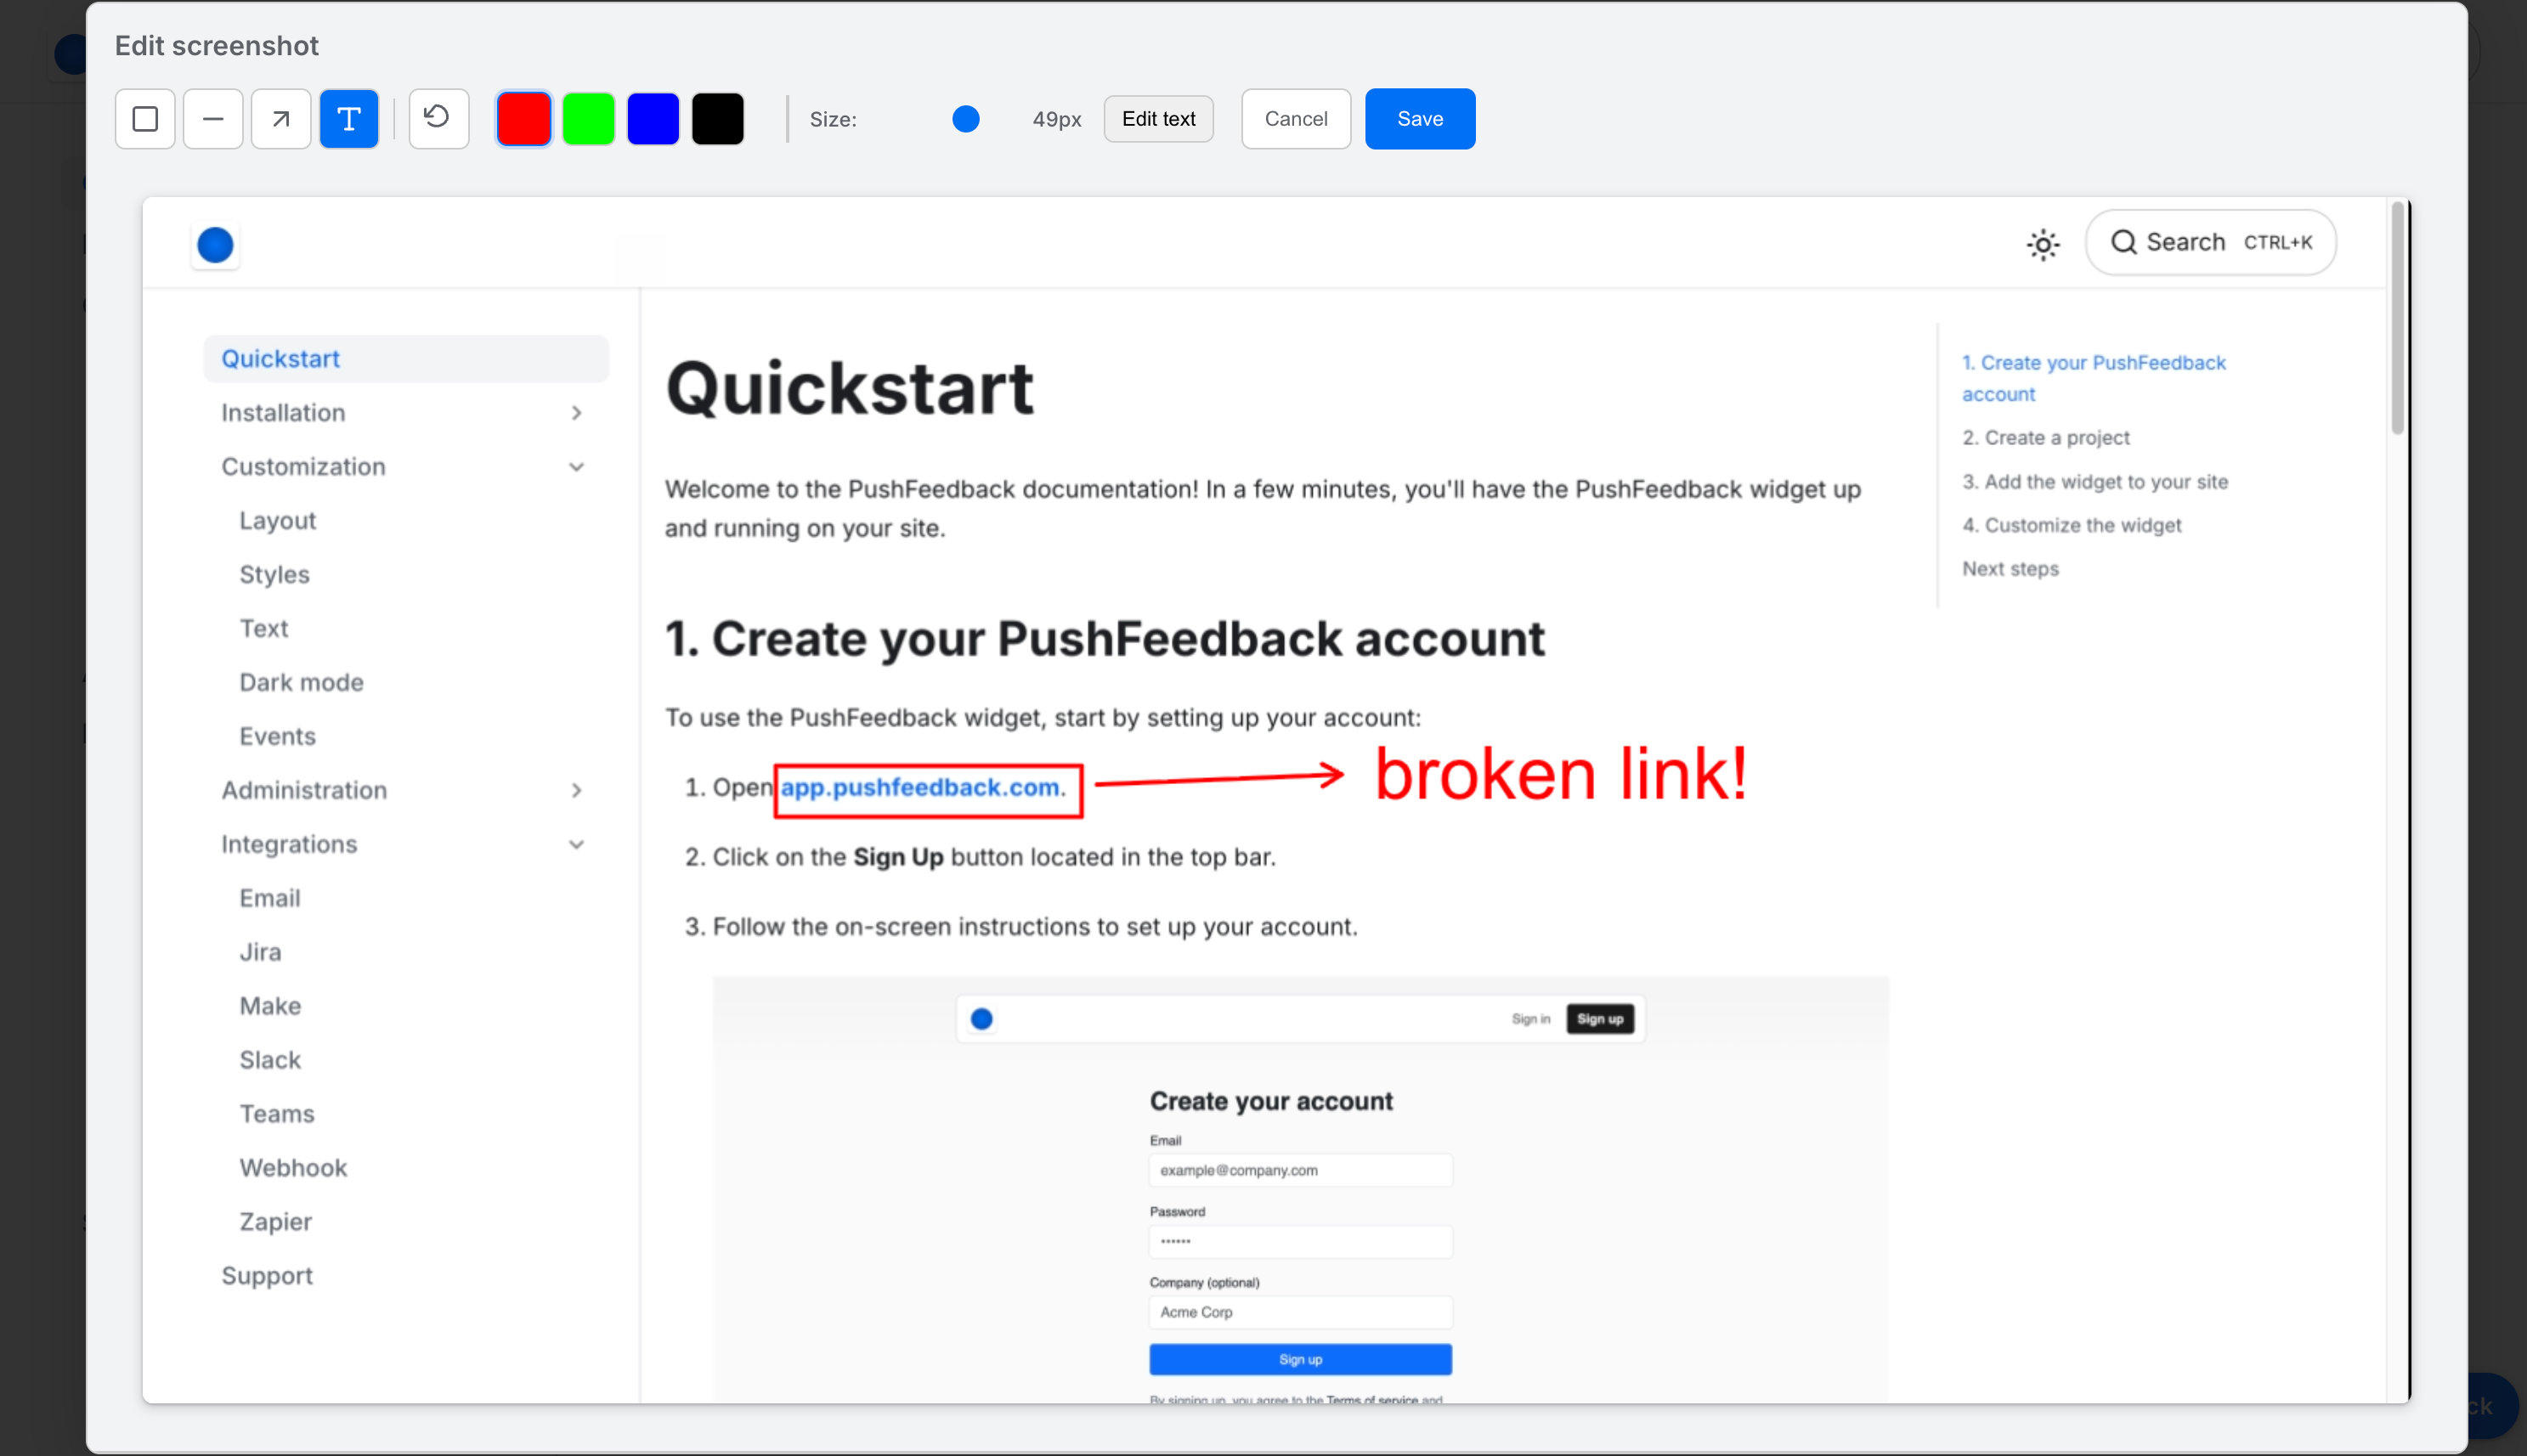
Step 2: Configure screenshot capture and the annotation editor
Screenshot capture is enabled by default. When a user opens the feedback modal and clicks the camera icon, the widget captures the current viewport and opens the annotation editor directly in the browser.
The annotation editor lets users:
- Draw freehand to circle or underline elements
- Add rectangular highlights over specific sections
- Use arrows to point at specific elements
The annotation is embedded in the screenshot before submission. What arrives in your dashboard is a single image that shows both the page state and the user's annotation.
No browser extension, no separate screen capture tool, no file upload. The entire flow happens in the modal without leaving the page.
For the docs on how visual feedback with annotations compares to text-only reporting, What is visual feedback and why your team needs it covers the signal quality difference in detail.
Step 3: Connect to Jira so reports land directly as issues
Manually forwarding feedback submissions to Jira is the fastest way to ensure nothing gets acted on. The copy-paste step creates a gap where reports accumulate in a dashboard, triage falls behind, and engineering never sees them.
The PushFeedback Jira integration creates issues automatically from feedback submissions using Jira Cloud Automation. Here's the setup:
Configure the Jira automation rule
- Go to your Jira project's Project settings and open Automation.
- Create a new rule with Incoming webhook as the trigger.
- Add a Then action and set it to Create work item.
- Configure the work item with these field mappings:
- Summary:
{{webhookData.summary}} - Description:
{{webhookData.description}}
- Summary:
- Enable the rule and copy the webhook URL and secret.
Configure PushFeedback
- In your PushFeedback project, go to Settings > Integrations > Jira.
- Paste the webhook URL and secret from Jira.
- Save.
From that point on, every feedback submission creates a Jira issue automatically. The issue includes the user's comment, the page URL, the annotated screenshot, and the browser/OS metadata in the description.
Full step-by-step instructions are in the Jira integration reference.
Step 4: Triage and close the loop
Automated routing handles the logistics. Triage is where you decide what to do with what arrives.
A practical triage framework for bug reports routed from visual feedback:
Immediate fix (this sprint). The report includes a clear reproduction path, the bug is confirmed in the same environment, and the impact is visible to users on a high-traffic page or critical flow. The annotated screenshot is enough to assign directly to a developer.
Needs investigation. The bug appears platform-specific, the reproduction is intermittent, or the submission doesn't include enough detail to assign confidently. Route to a developer for a short investigation before committing to the sprint.
Expected behavior. The user experienced something they expected to work differently, but the behavior is intentional. Close the issue with a note and consider whether the UX needs to be clearer.
Duplicate. A second or third report of the same bug. Add it as a comment to the existing issue and use it as evidence of user impact when prioritizing.
For closing the loop: when a bug is fixed, note the date and the page the report came from. If you're tracking feedback metrics, check whether reports of that issue drop after the fix is deployed. A 70 percent reduction in similar feedback on that page within two weeks is concrete evidence the fix worked.
What a good visual bug report looks like
Good example:
A user submits feedback on your payment checkout page. The screenshot shows the "Place order" button grayed out after entering card details. Their annotation circles the button. The submission includes: Chrome 124 on macOS 14.4, 1440x900 viewport, URL ending in /checkout/payment.
A frontend developer receives the Jira issue, opens the URL in Chrome 124, sets their viewport to 1440x900, and reproduces the issue on the first attempt. Fix shipped within the same sprint.
Bad example: Email from a user: "The payment isn't working, I keep getting stuck at the last step. I'm using a computer."
This report generates three emails, a 30-minute Zoom call, and a screen share before the engineer has enough context to write a reproduction case.
The difference is not the severity of the bug. It's the completeness of the initial report.
The compounding value of visual bug reports
The per-bug time savings are significant, but the compounding value shows up in two other places.
First, visual reports are skimmable. A developer reviewing the Jira backlog can look at 20 annotated screenshots in five minutes and get an accurate sense of which bugs are most impactful without reading descriptions. Text-only bug reports require reading every one.
Second, visual reports are more specific, which makes prioritization more accurate. When the screenshot shows which element is broken on which page, you can estimate fix effort with more confidence. Text descriptions that say "the dashboard is broken" can represent anything from a one-line CSS fix to a multi-day architectural issue.
Accurate prioritization means the highest-impact bugs get fixed first, not the ones with the most verbose descriptions.
PushFeedback embeds a feedback widget with built-in screenshot capture and annotation on any web app or documentation site. Submissions route automatically to Jira with all the context an engineer needs to reproduce and fix the issue. You can get started with the installation guide in minutes.