The complete guide to collecting and analyzing documentation feedback
Your documentation is live. Users visit it every day. But how do you know if it's actually helping them?
Most documentation teams rely on page views and gut feeling. That's not enough. The teams that ship great docs collect structured feedback from readers, analyze it for patterns, and use those insights to prioritize what to fix.
This guide covers the full process, from choosing a feedback method to using AI to analyze what users tell you.
Why documentation feedback matters
Documentation isn't a "publish and forget" asset. APIs change, products evolve, and what made sense six months ago might confuse users today.
Without feedback, you're guessing:
- Which pages are outdated?
- Where do users get stuck?
- What content is missing entirely?
- Are your tutorials actually helping people complete the task?
Feedback answers these questions with data, not assumptions.
The cost of bad documentation
Poor documentation doesn't just frustrate users. It creates measurable business impact:
- Support ticket volume increases. When docs don't answer questions, users contact support instead.
- Onboarding slows down. New users take longer to get started when guides are unclear.
- Developer adoption drops. For API products, confusing docs are the number one reason developers abandon a platform.
- Internal teams waste time. Engineers answer the same questions that better docs would prevent.
Collecting feedback helps you catch these problems before they scale.
How to collect documentation feedback
There are several approaches, each with trade-offs.
1. Embedded feedback widgets
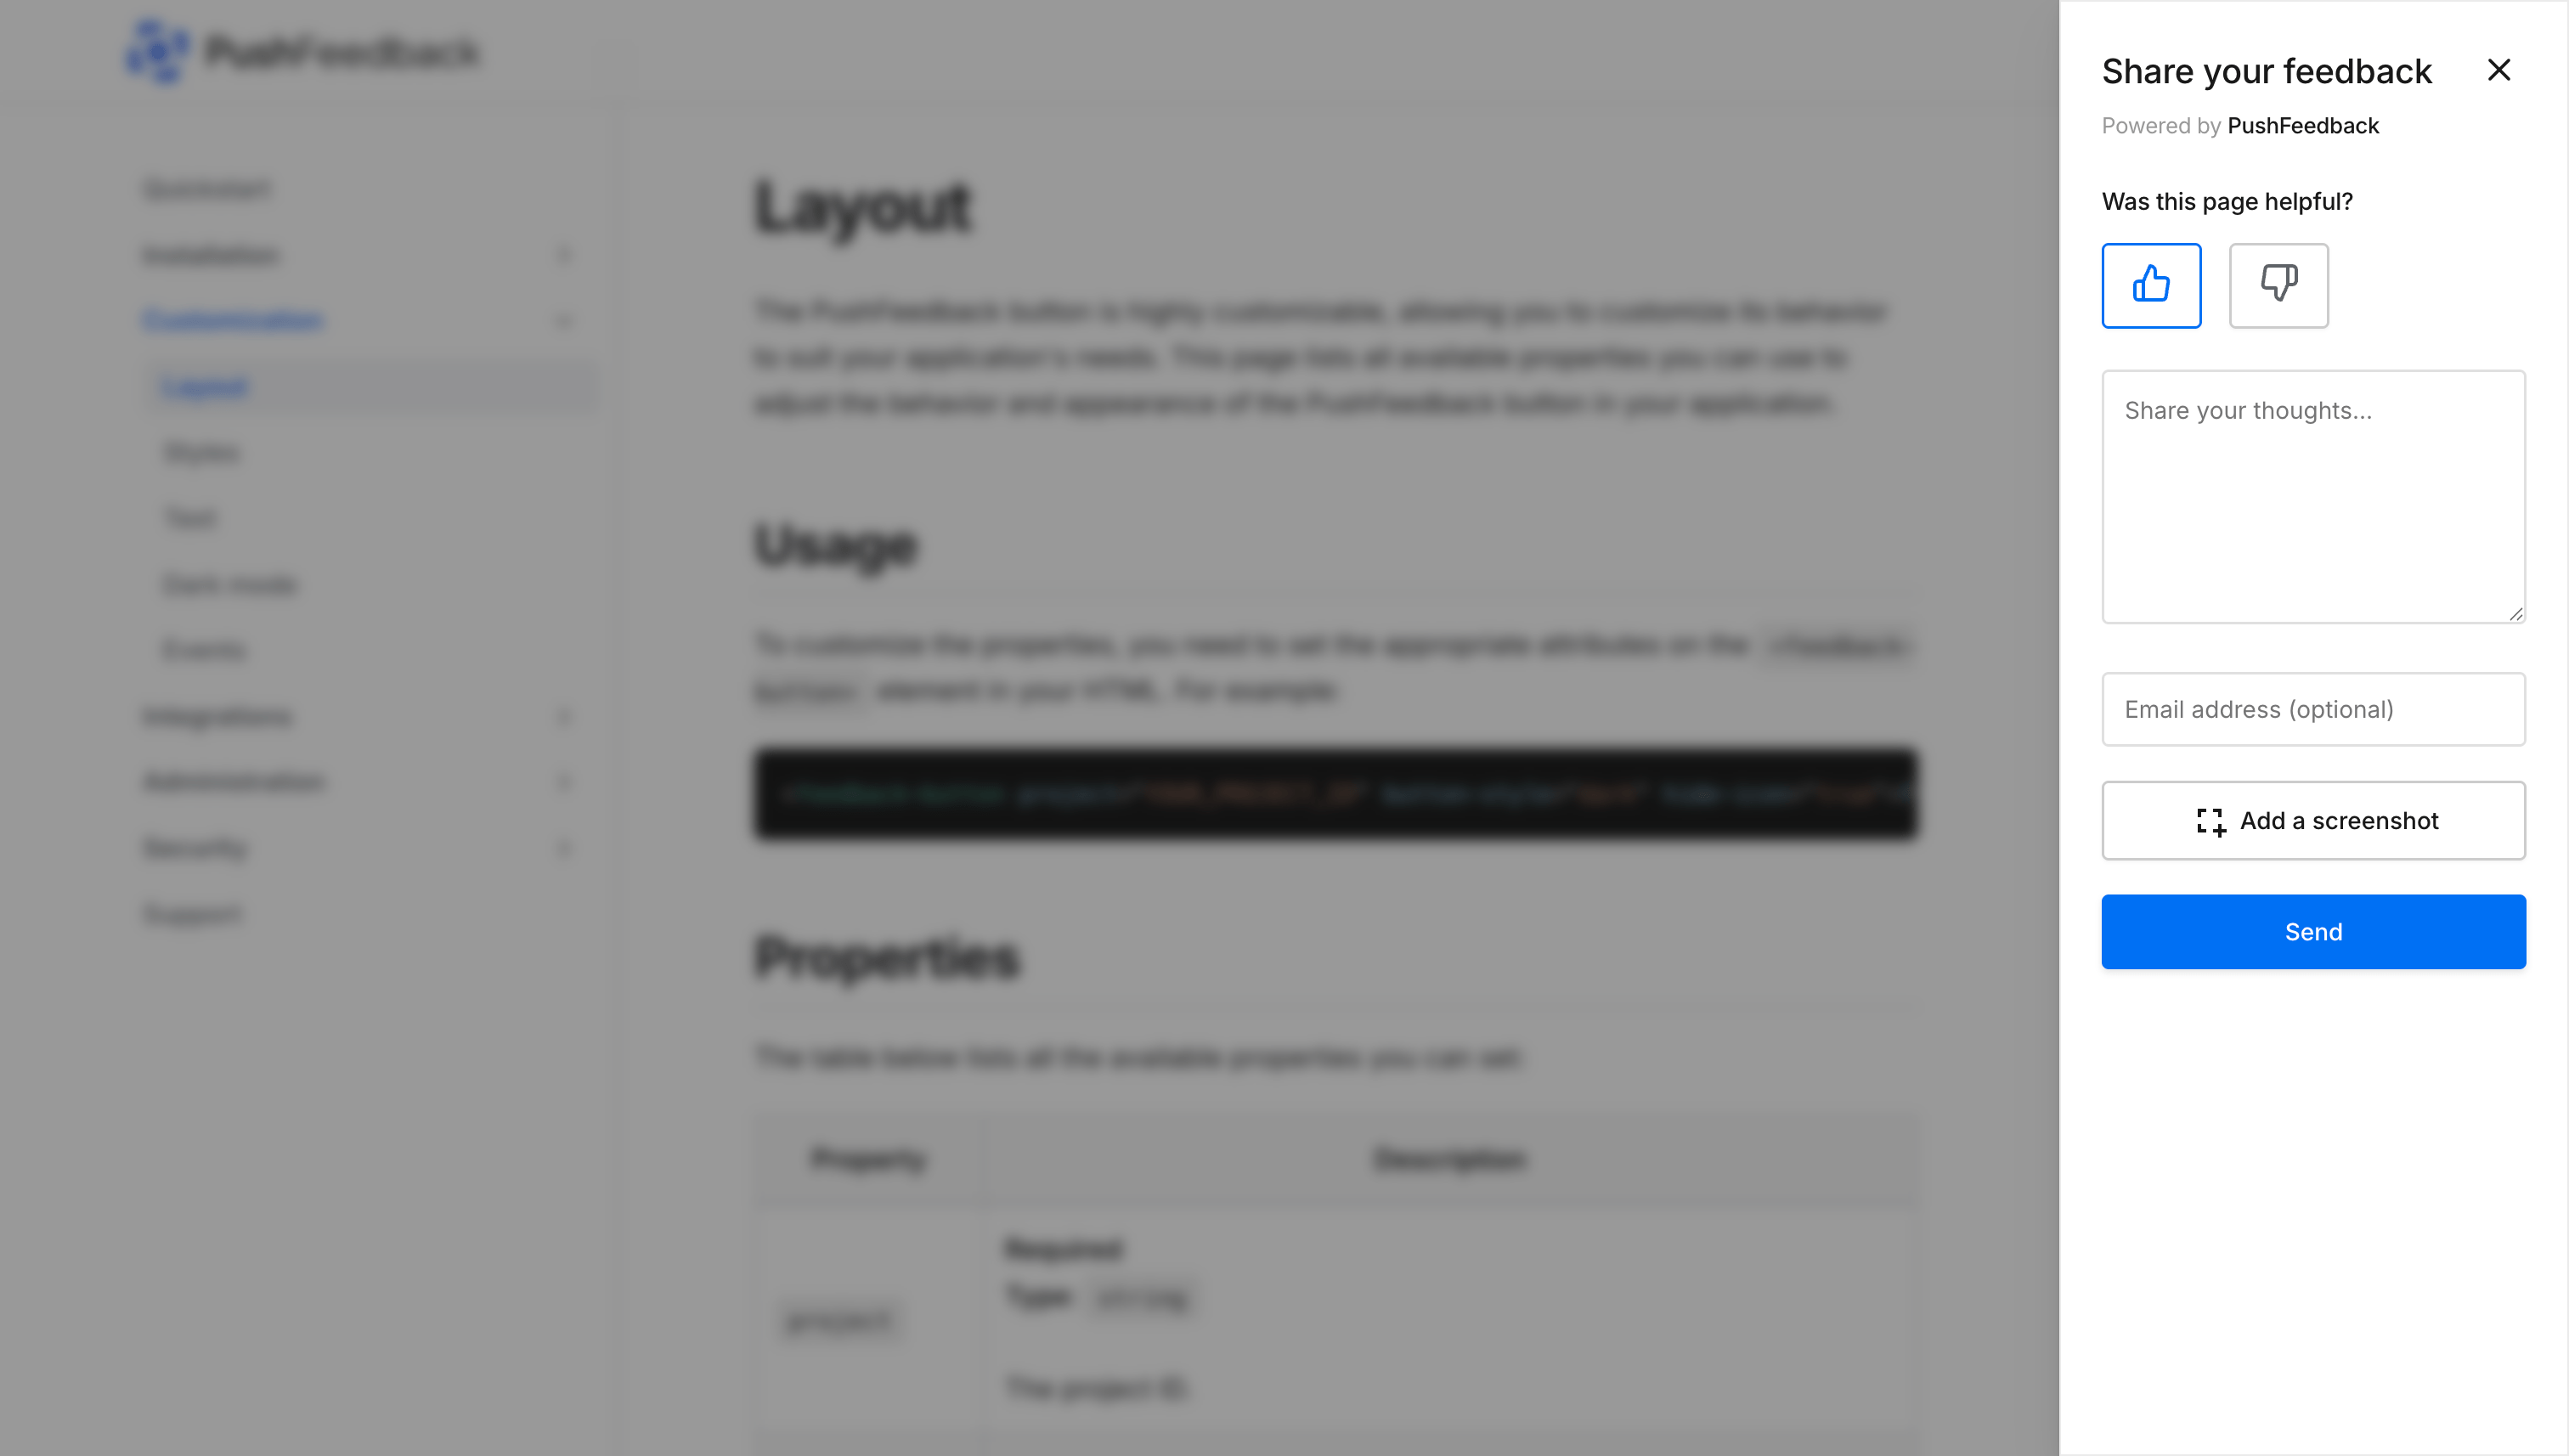
A feedback widget sits directly on each documentation page, typically as a "Was this page helpful?" prompt or a floating button. Users can leave a rating, a comment, or both without leaving the page.
Pros:
- Low friction. Users give feedback in context.
- Page-level granularity. You know exactly which page the feedback is about.
- Works with any documentation platform (Docusaurus, MkDocs, Next.js, Sphinx, etc.)
Cons:
- Only captures feedback from users who choose to interact.
- Short comments may lack detail without structured prompts.
This is the approach PushFeedback uses: a customizable widget that collects ratings, comments, and screenshots directly on your docs pages.
2. Surveys
Periodic surveys (NPS, CSAT, or custom) sent via email or shown as pop-ups.
Pros:
- Can ask specific, structured questions.
- Captures feedback from users who might not use a widget.
Cons:
- Lower response rates.
- Feedback isn't tied to a specific page.
- Can feel intrusive if overused.
3. Support ticket analysis
Mining your support inbox for documentation-related issues.
Pros:
- Reflects real user problems.
- Often includes detailed context.
Cons:
- Reactive. You only learn about issues when users escalate.
- Hard to categorize and quantify systematically.
4. Analytics and heuristics
Using page analytics (time on page, bounce rate, search queries) as indirect signals.
Pros:
- No user effort required.
- Available at scale.
Cons:
- Tells you what happens, not why.
- High bounce rate could mean the page answered the question quickly, or that it was useless.
Which method should you use?
The most effective approach combines an embedded feedback widget (for continuous, page-level input) with analytics (for scale and indirect signals). Surveys and support analysis work well as supplements but shouldn't be your primary source.
What to ask users
The feedback you collect is only as useful as the questions you ask. Here are approaches that work well for documentation:
Binary rating + optional comment
The simplest pattern: "Was this page helpful?" with thumbs up/down, followed by an optional text field.
- Works because: low friction, high completion rate.
- Best for: identifying which pages have problems (not necessarily why).
Structured categories
Ask users to categorize their feedback: "What was the issue?" with options like Missing information, Outdated content, Hard to understand, Code example doesn't work.
- Works because: makes feedback easier to analyze at scale.
- Best for: teams with high feedback volume who need to triage efficiently.
Open-ended comments with screenshots
Let users describe the issue in their own words and optionally attach a screenshot showing what they see.
- Works because: captures context that ratings alone can't.
- Best for: catching specific issues (broken code, confusing diagrams, wrong parameters).
What NOT to ask
- Don't ask too many questions. Each additional field reduces completion rate.
- Don't require personal information. Anonymous feedback is more honest.
- Don't use jargon in your prompts. "Rate the efficacy of this content" won't get responses.
How to analyze documentation feedback
Collecting feedback is the easy part. The hard part is making sense of it.
Manual analysis (small scale)
If you receive fewer than 50 feedback items per month, manual review works fine:
- Read each comment.
- Tag it with a category (missing content, unclear explanation, outdated, broken example).
- Group by page to identify which pages need the most attention.
- Prioritize by volume and severity.
This approach breaks down around 100+ items per month. Reading every comment becomes unsustainable, and patterns get buried.
Dashboard analytics (medium scale)
A feedback dashboard gives you structured views of your data:
- Sentiment breakdown. How much feedback is positive, negative, or neutral.
- Page-level metrics. Which specific pages get the most negative feedback.
- Trend lines. Is feedback improving or getting worse over time.
- Newly active pages. Pages that just started receiving feedback.
This level of analysis helps you spot problems without reading every comment. PushFeedback's analytics dashboard provides these views out of the box.
AI-powered analysis (any scale)
When you have hundreds of feedback items, AI can do what manual review can't:
- Theme detection. Automatically group feedback into recurring topics.
- Sentiment analysis. Classify each item as positive, negative, or neutral.
- Priority ranking. Surface the most mentioned issues first.
- Executive summaries. Distill hundreds of comments into a concise overview.
- Actionable recommendations. Suggest concrete steps based on the patterns.
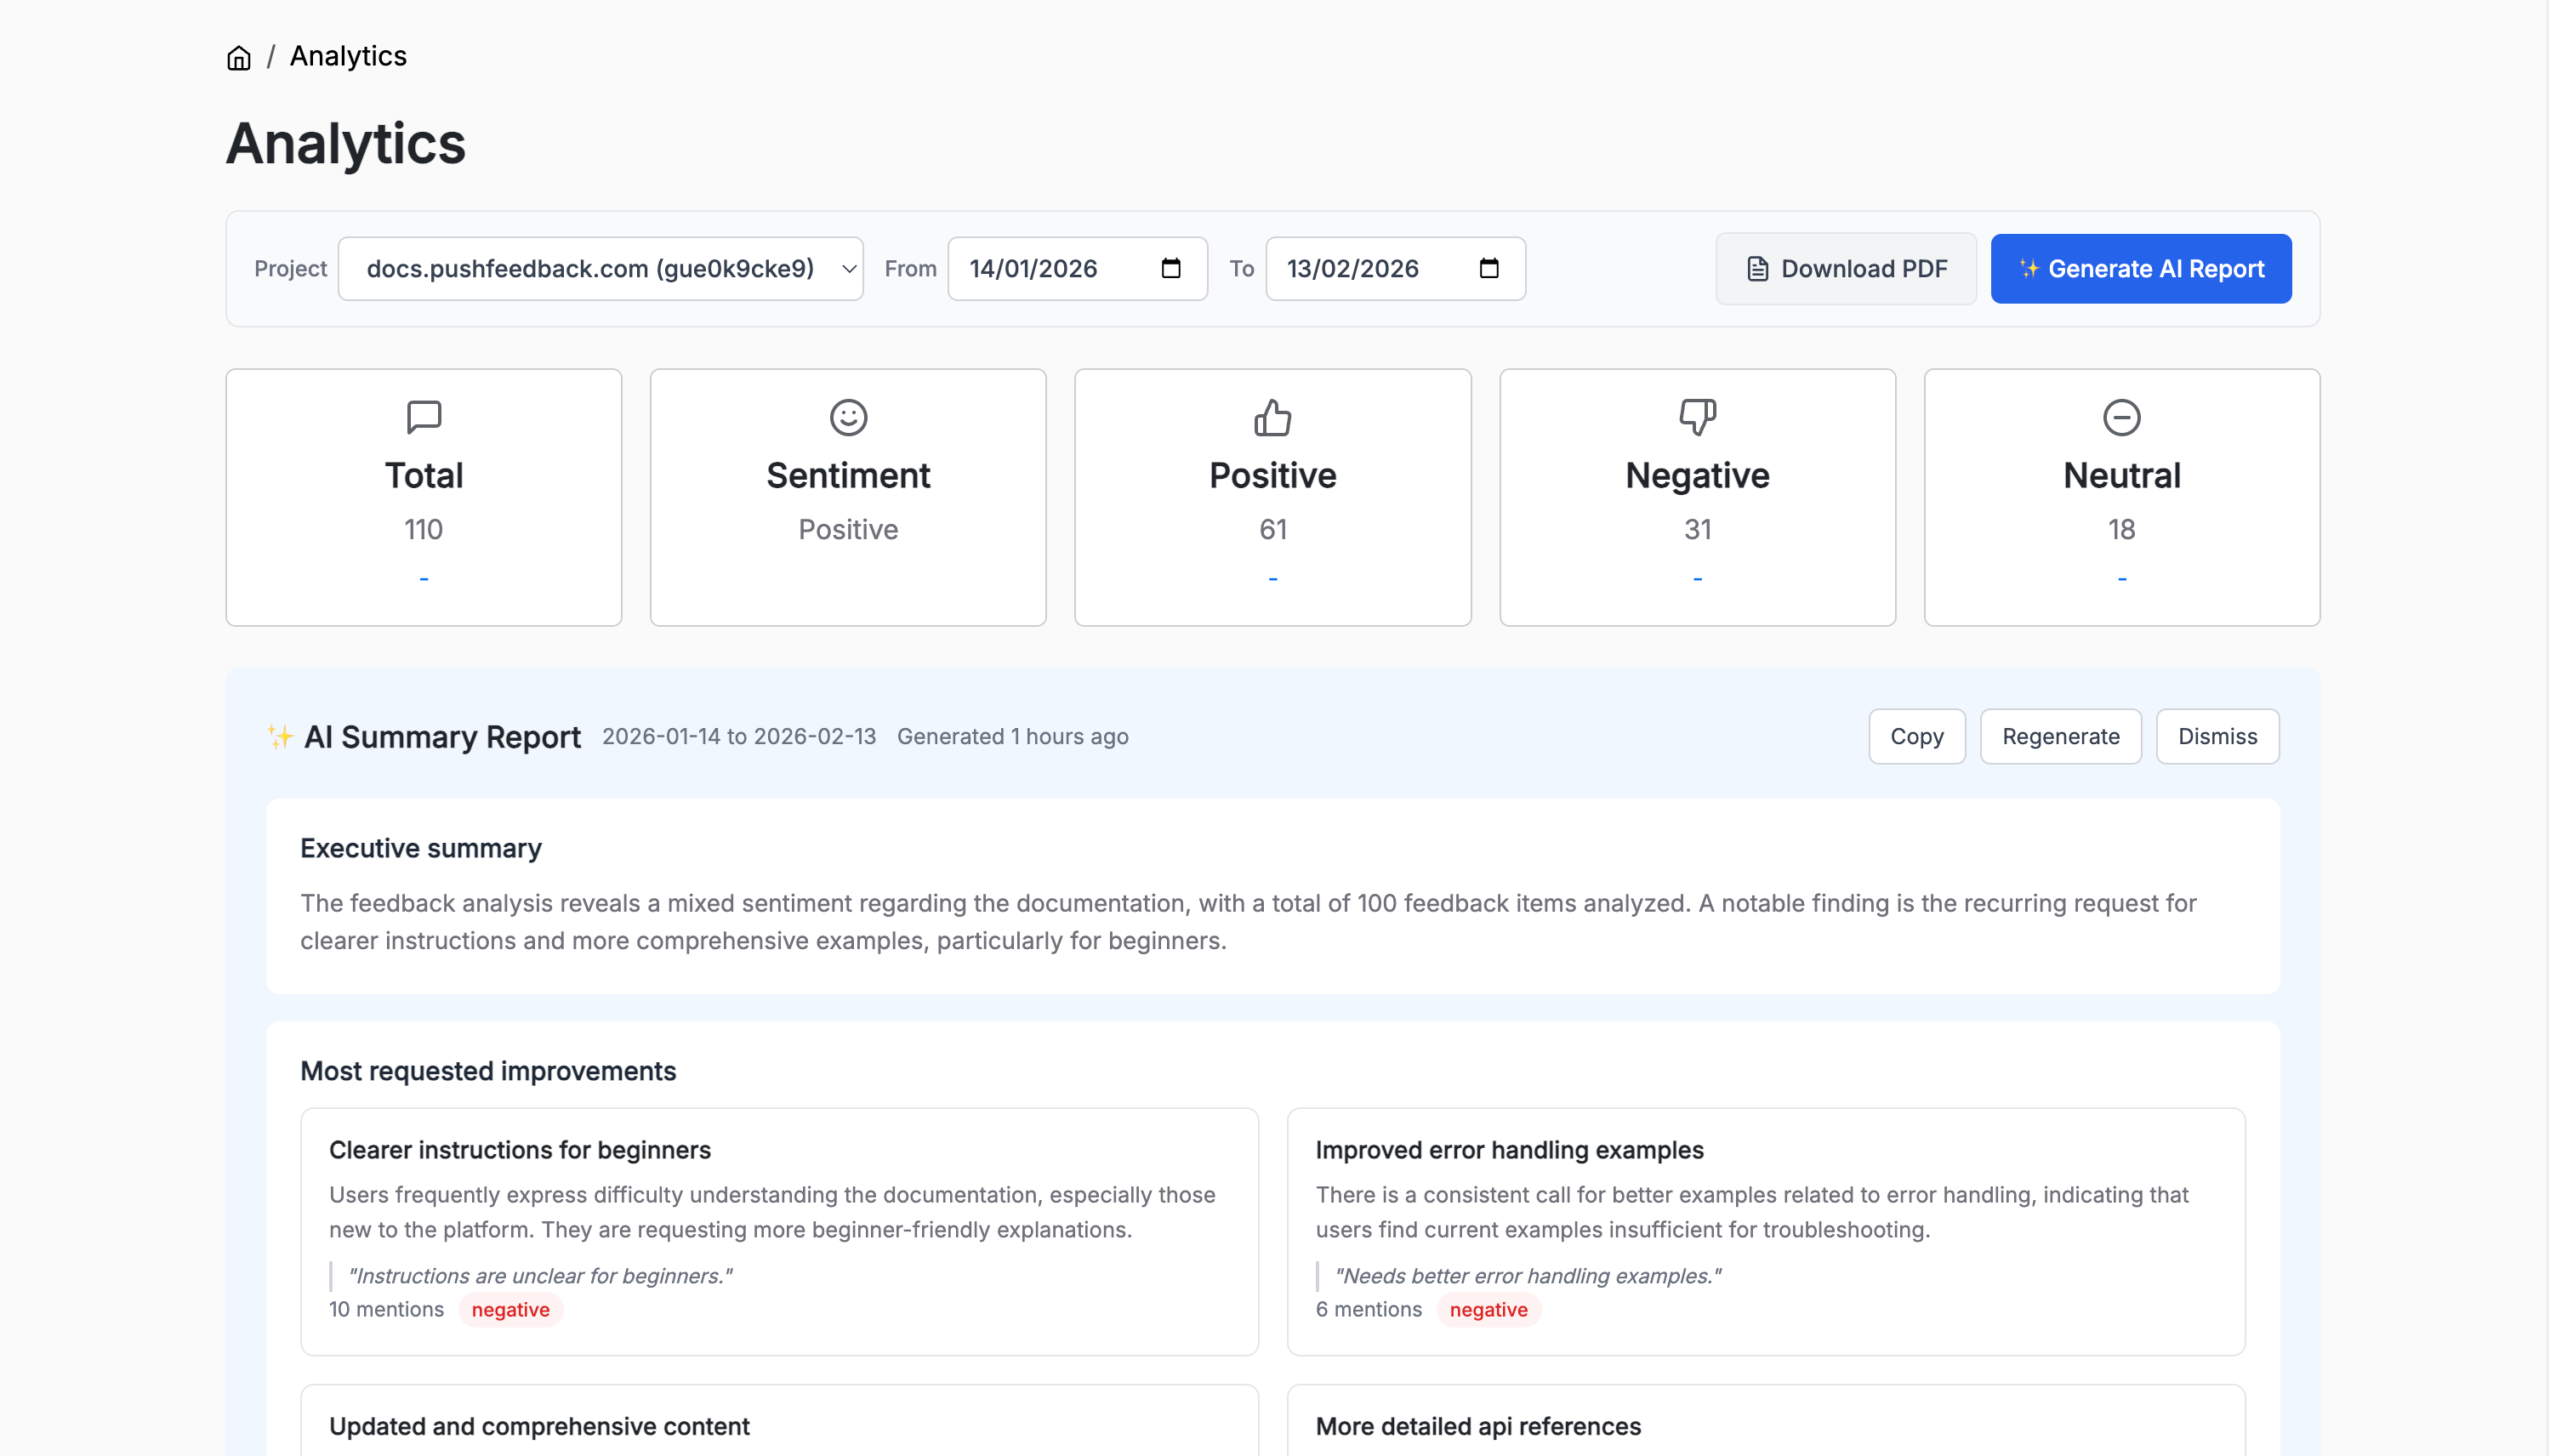
This is where AI Reports come in. With one click, the system analyzes your feedback and generates a structured report with:
- An executive summary covering volume, sentiment, and the top finding.
- The most requested improvements, up to 5 themes with mention counts and representative quotes.
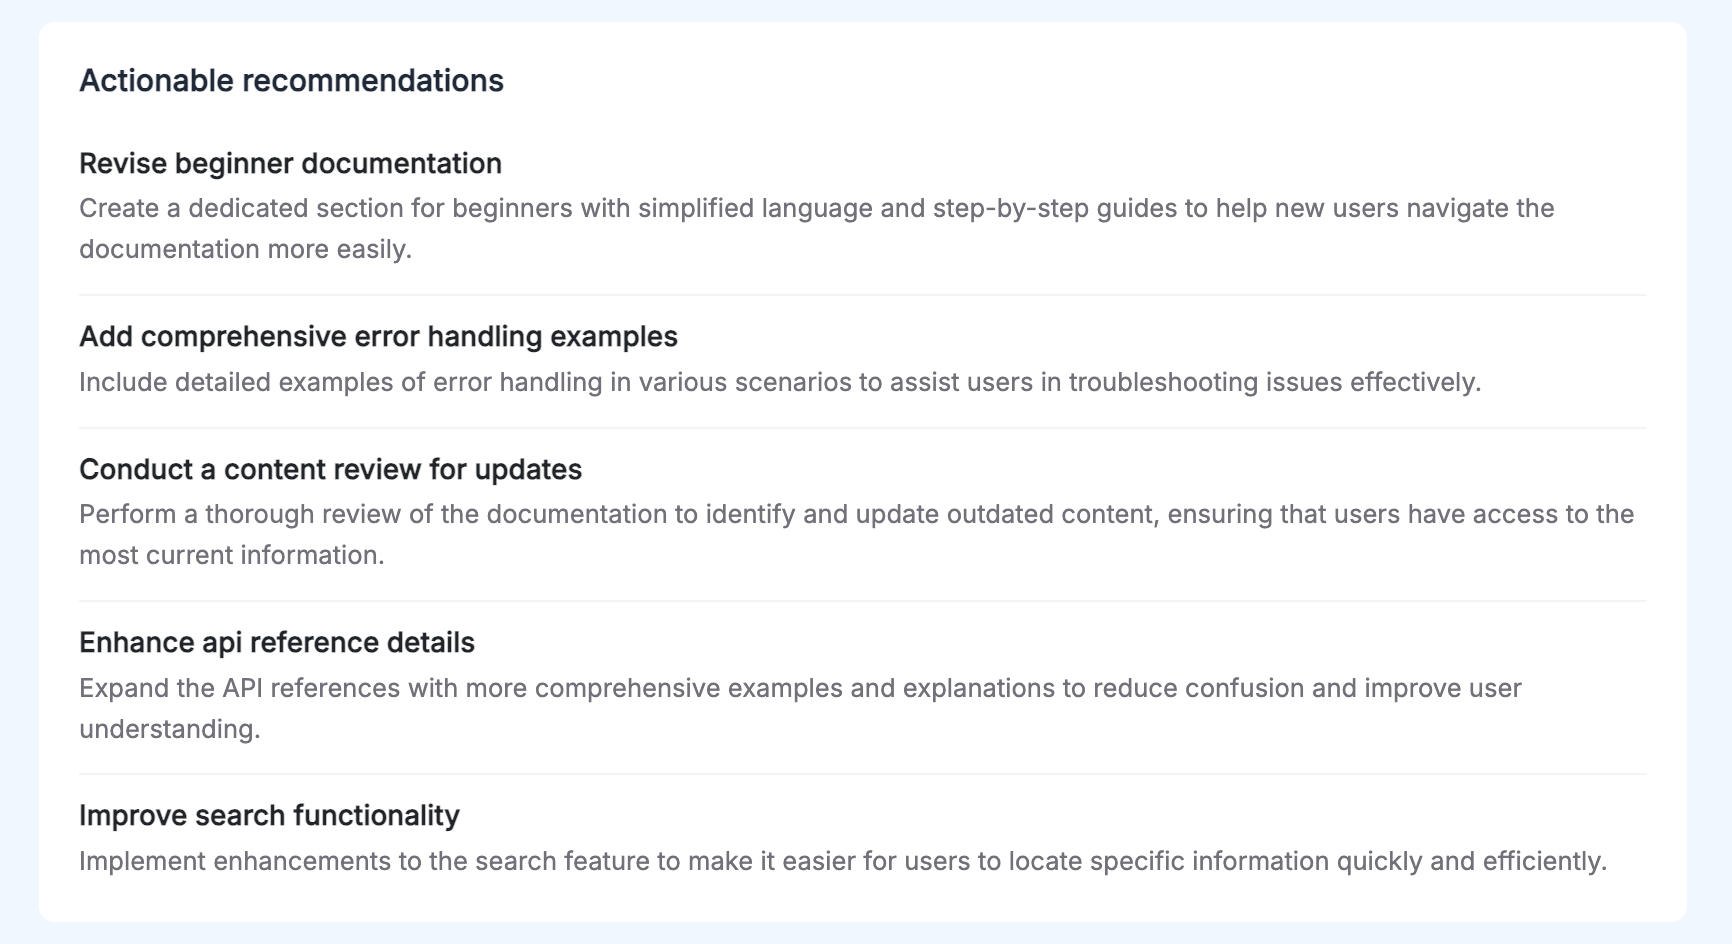
- Actionable recommendations, 3 to 5 specific steps your team can take.
The key advantage of AI analysis isn't just speed. It catches patterns that humans miss when they're reading comments one at a time.
Turning feedback into action
Analysis without action is wasted effort. Here's how to close the loop.
1. Triage by impact
Not all feedback is equal. Prioritize based on:
- Volume. How many users mentioned the same issue?
- Severity. Does the issue block users from completing a task?
- Page importance. Is this a high-traffic page or an onboarding guide?
2. Create a documentation roadmap
Treat documentation updates like product work. Use your feedback data to create a prioritized list of fixes:
| Priority | Page | Issue | Mentions |
|---|---|---|---|
| High | /api/authentication | Missing OAuth2 example | 23 |
| High | /getting-started | Steps outdated after v3 | 18 |
| Medium | /guides/webhooks | Confusing diagram | 9 |
| Low | /reference/errors | Minor typo | 2 |
3. Track the effect of changes
After updating a page, monitor whether feedback sentiment improves. If a page had 80% negative feedback before your update and 60% positive after, you know the change worked.
This creates a feedback loop: collect, analyze, fix, measure.
4. Share insights with your team
Documentation feedback often reveals product issues, not just docs issues. "The API returns a 500 error when I follow the tutorial" isn't a docs problem. It's a bug.
Share relevant feedback with:
- Product teams. Feature requests and confusion points that indicate UX issues.
- Engineering. Bug reports surfaced through docs feedback.
- Support. Common questions that could be answered with better docs.
Tools for documentation feedback
| Tool | Type | Best for |
|---|---|---|
| PushFeedback | Widget + Analytics + AI | Documentation teams wanting collection and AI-powered analysis in one tool |
| Google Analytics | Page analytics | Indirect signals like bounce rate and time on page |
| Hotjar | Heatmaps + surveys | Visual behavior analysis |
| GitHub Issues | Issue tracking | Open-source documentation projects |
Getting started
If you're not collecting documentation feedback yet, start simple:
- Add a feedback widget to your docs. Even a basic "Was this helpful?" captures signal.
- Review feedback weekly. Set aside 30 minutes to read what users are saying.
- Fix the top 3 pages with the most negative feedback each month.
- Scale with AI. When manual review becomes unsustainable, use AI Reports to surface patterns automatically.
The teams that ship the best documentation aren't the ones with the most writers. They're the ones that listen to their users.