

Analytics dashboard for feedback trends and page performance
The analytics dashboard shows feedback volume, sentiment, and a comparison against the previous period, so you can read the trend instead of one submission at a time.
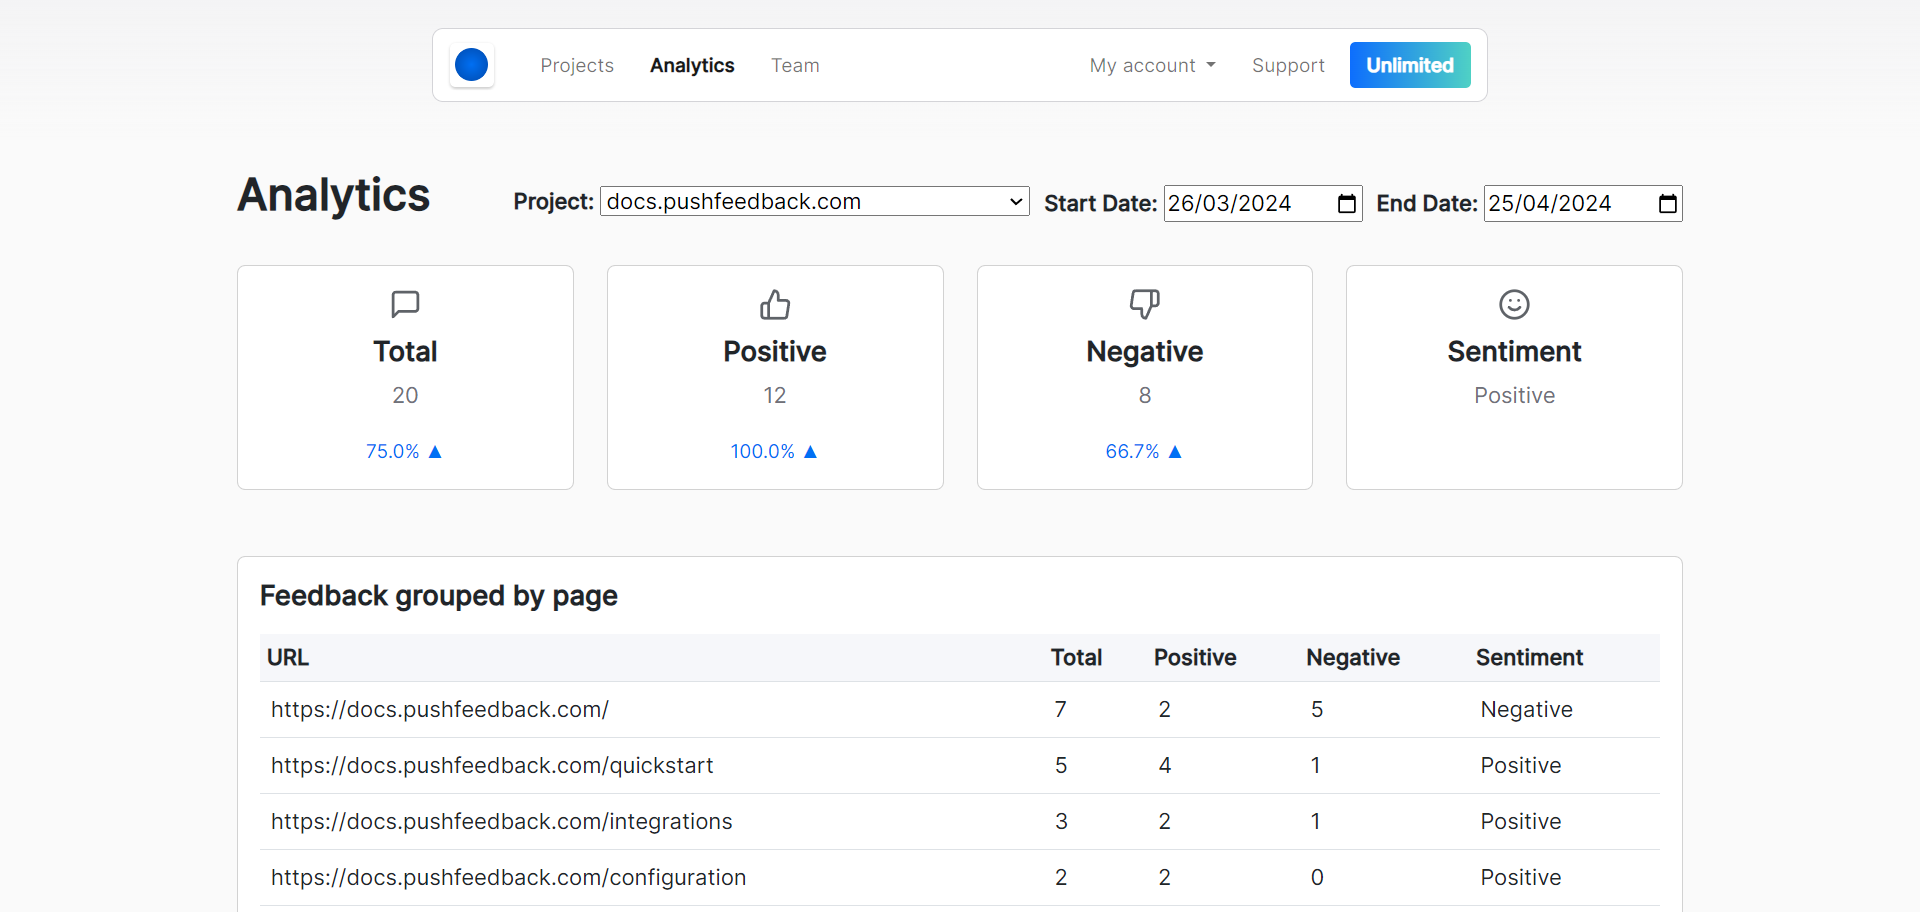
It also groups feedback by page. That is the view most documentation teams end up living in, because it answers the question that starts every review: which page do we fix first.
Open it under Analytics in your PushFeedback account.
Sort by page and look for clusters. One page with 15 negative ratings is a better use of an afternoon than 15 pages with one each.
The feedback management tool covers the rest of the dashboard, and how to measure the quality of your technical documentation covers which of these numbers are worth tracking.